Efficiënter grondgebruik door inzet Dashboard Verstedelijking
05 02 2021English version below: Dashboard Urbanisation rationalises densification
De woningcrisis is zeer complex. De meeste experts zijn het erover eens dat een gebrek aan bouwlocaties één van de grootste problemen is. Om een holistisch beeld te schetsen van waar te bouwen en waar niet, hebben data scientists van Rebel en Springco Dashboard Verstedelijking in elkaar gezet.
Vroeger gingen we huizen bouwen op plekken waar de grond goedkoop was, oftewel buiten de stad. Weilanden stonden vol met woonwijken, maar de inwoners werkten nog steeds in de stad. Treinsporen, snelwegen en andere infrastructuur moest worden aangelegd en uiteindelijk waren de kosten net zo hoog als wanneer er verder verdicht zou worden in de stad. Het forenzen had hiermee voorkomen kunnen worden en daarmee de bijkomende CO2 uitstoot.
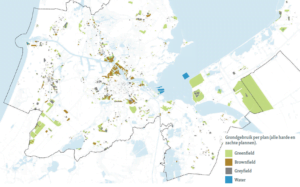
Het dashboard integreert economische, sociale, milieutechnische en vele andere indicatoren
Door real-time data input is het dashboard altijd up-to-date
Het Dashboard Verstedelijking is ontwikkeld om een holistisch overzicht te krijgen van waar wel en niet gebouwd moet worden. Binnen dit online dashboard kunnen gebruikers projectlocaties inzien en krijgen zij een volledig overzicht van de kosten en de baten die het kan opleveren als binnen deze projectlocaties gebouwd wordt. Om te weten wat deze kosten en baten zouden zijn hebben wij verschillende datasets en live verbindingen bij elkaar gebracht en deze verwerkt in een zogenaamde ‘Application Programming Interface’ (API). Het dashboard is hierdoor altijd up-to-date en flexibel om nieuwe data of functionaliteiten aan toe te kunnen voegen.
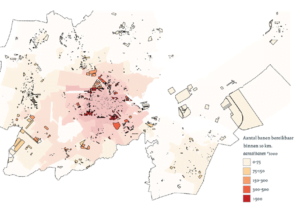
Duurzaam grondgebruik is een essentieel onderdeel van hedendaagse stedenbouw
Binnenstedelijke verdichting
Wanneer de projectlocaties duidelijk zijn kunnen verschillende scenario’s met elkaar vergeleken worden om te experimenteren met verschillende combinaties van projectlocaties . Uiteindelijk levert het dashboard per scenario een grondexploitatie op waarmee besloten kan worden waar en hoe het beste verdicht kan worden om uiteindelijk het huizentekort op te lossen, het aanleggen van dure infrastructuur te minimaliseren en daarmee de uitstoot van forenzen.
Het dashboard is hiermee niet af. Aangezien het Dashboard Verstedelijking op dit moment voornamelijk grondexploitaties maakt en wij een zo holistisch mogelijk overzicht willen geven, voorzien wij in de (nabije) toekomst meer functionaliteit toe te voegen aan het dashboard.
Dashboard Urbanisation rationalises densification
The housing crisis we currently face is a complex one. However, most experts recognise that the lack of development sites is one of the main problems. To get a holistic overview of where to build and where not to build, our data scientists have developed the Dashboard Urbanisation.
In the past, we started building houses in places where the land was cheap, i.e. outside the city. Meadows were full of residential areas, but residents still worked in the city. Train tracks, highways and other infrastructure had to be built and in the end the costs were just as high as when the city were to be further densified. Commuting could have been prevented and thereby the additional CO2 emissions.
The dashboard integrates economic, social, environmental, and many other indicators
Real-time data influx
To get a holistic overview of where to build and where not to build, we developed the Dashboard Urbanisation. In this online dashboard, users can view project locations. They can get a complete overview of the costs and benefits that can be generated if construction takes place within these project locations. In order to know what these costs and benefits would be, we brought together various datasets and live connections and processed them in a so-called “Application Programming Interface” (API). The dashboard is therefore always up-to-date and flexible enough to add new data or functionalities.
Sustainable land use is an essential element of contemporary urban planning
Urban densification
When the project locations are clear, different scenarios can be compared to experiment with different combinations of project locations. Ultimately, the dashboard delivers land exploitations per scenario which can be used to decide where and how urban densification can be executed – ultimately helping to solve the housing shortage, minimise the construction of expensive infrastructure and thus, the emissions of commuters.
But the dashboard is not finished. Since the Dashboard Urbanisation currently mainly produces land development business models and we want to provide an overview that is as holistic as possible, we plan to add more functionalities to the dashboard in the (near) future.