English | Data-driven location search for new healthcare centres
04 02 2021Een Nederlandse versie van dit artikel is op 17 februari gepubliceerd: Datagedreven locatiestudie nieuwe gezondheidscentra
The cost of healthcare is rising and the forecast is it will continue to do so in the coming decades. Ageing populations, high-tech solutions and – paradoxically – better services (formerly fatal diseases become chronic ones) are amongst the primary causes.
This means that all related costs need to be reviewed and – subsequently – reduced as much as possible. Without going into the heavily politicised debate on market principles and competition within healthcare, almost everyone agrees that hospitals and healthcare centres should be located where demand is the highest. Because then the aggregate travel time is as low as possible. But how on earth does one calculate where healthcare demand is highest? Well, buckle up, hold tight, and enjoy the data scientist’s ride.
Profiling demand
In the world-renowned healthcare system of the Netherlands, health insurance companies play an important role. Everyone is obliged to take out basic insurance, and the insurance companies then negotiate contracts with physicians, individual hospitals and other healthcare providers. Vektis collects data from health insurance companies and publishes an annual review, which is publicly available. This review summarises the amount of money spent on healthcare, and breaks the expenditure down by gender, age group and residence. The latter is aggregated because of privacy reasons (PC3 level, for the Dutch readers).
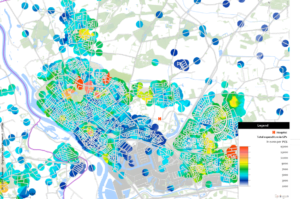
Approximated expenditure on (fictional) General Practice visits per PC6 area across Deventer
Combining the Vektis data and the household data Springco Urban Analytics monitors on a more accurate geographical level, we are able to approximate expenditure on PC6 level (about 15 households). We can now determine where people spend most money on general practices, as you can see above, or on, say, mental healthcare. Depending on the specific disciplines the new healthcare centres cover, one should choose which healthcare expenditure is of (greater) importance. But one could also train the model by integrating anonymized patient data from the hospital. With machine learning techniques (neural network analysis, support vector machine, a.o.) we subsequently predict the chance of different households to become care consumers.
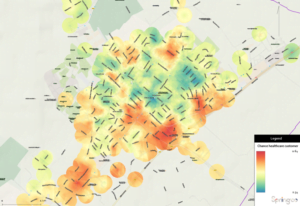
Predicted chance of (fictional) households in Wassenaar to become customers of new healthcare centres
Prescriptive (?) location outcome
Now suppose that the population in Wassenaar ages in such a manner that the local hospital wants to build not one but four healthcare centres in the city. What would be the spatial optimum given the demand for healthcare? We first combine the predicted chance of households to become customers with data on population density, which illustrates the concentration of demand. Then, we look for the four locations in the city where the healthcare centres should be built by using a cluster analysis. The animation below shows how this type of data analysis takes shape in practice.
This type of analysis could be done for all types of public and private services, whether it concerns waste collection, primary schools or EV charging points. Just ask your nearest data colleague what the (endless) possibilities are!